§ News
By AI Blog Editor
Oct 1, 2026 · 17 min read
The capability was never the bottleneck — Anthropic's robot exposure index finds robots can do 74% of U.S. physical job tasks and can afford to do 0.3% of them, with a historical-trend projection that puts the crossover at roughly forty years.
On September 30 Anthropic published a robot exposure index across 19,000 O*NET tasks. Robots clear 74% of physical capability and 0.3% of cost today, with a forty-year crossover at historical price-decline rates.
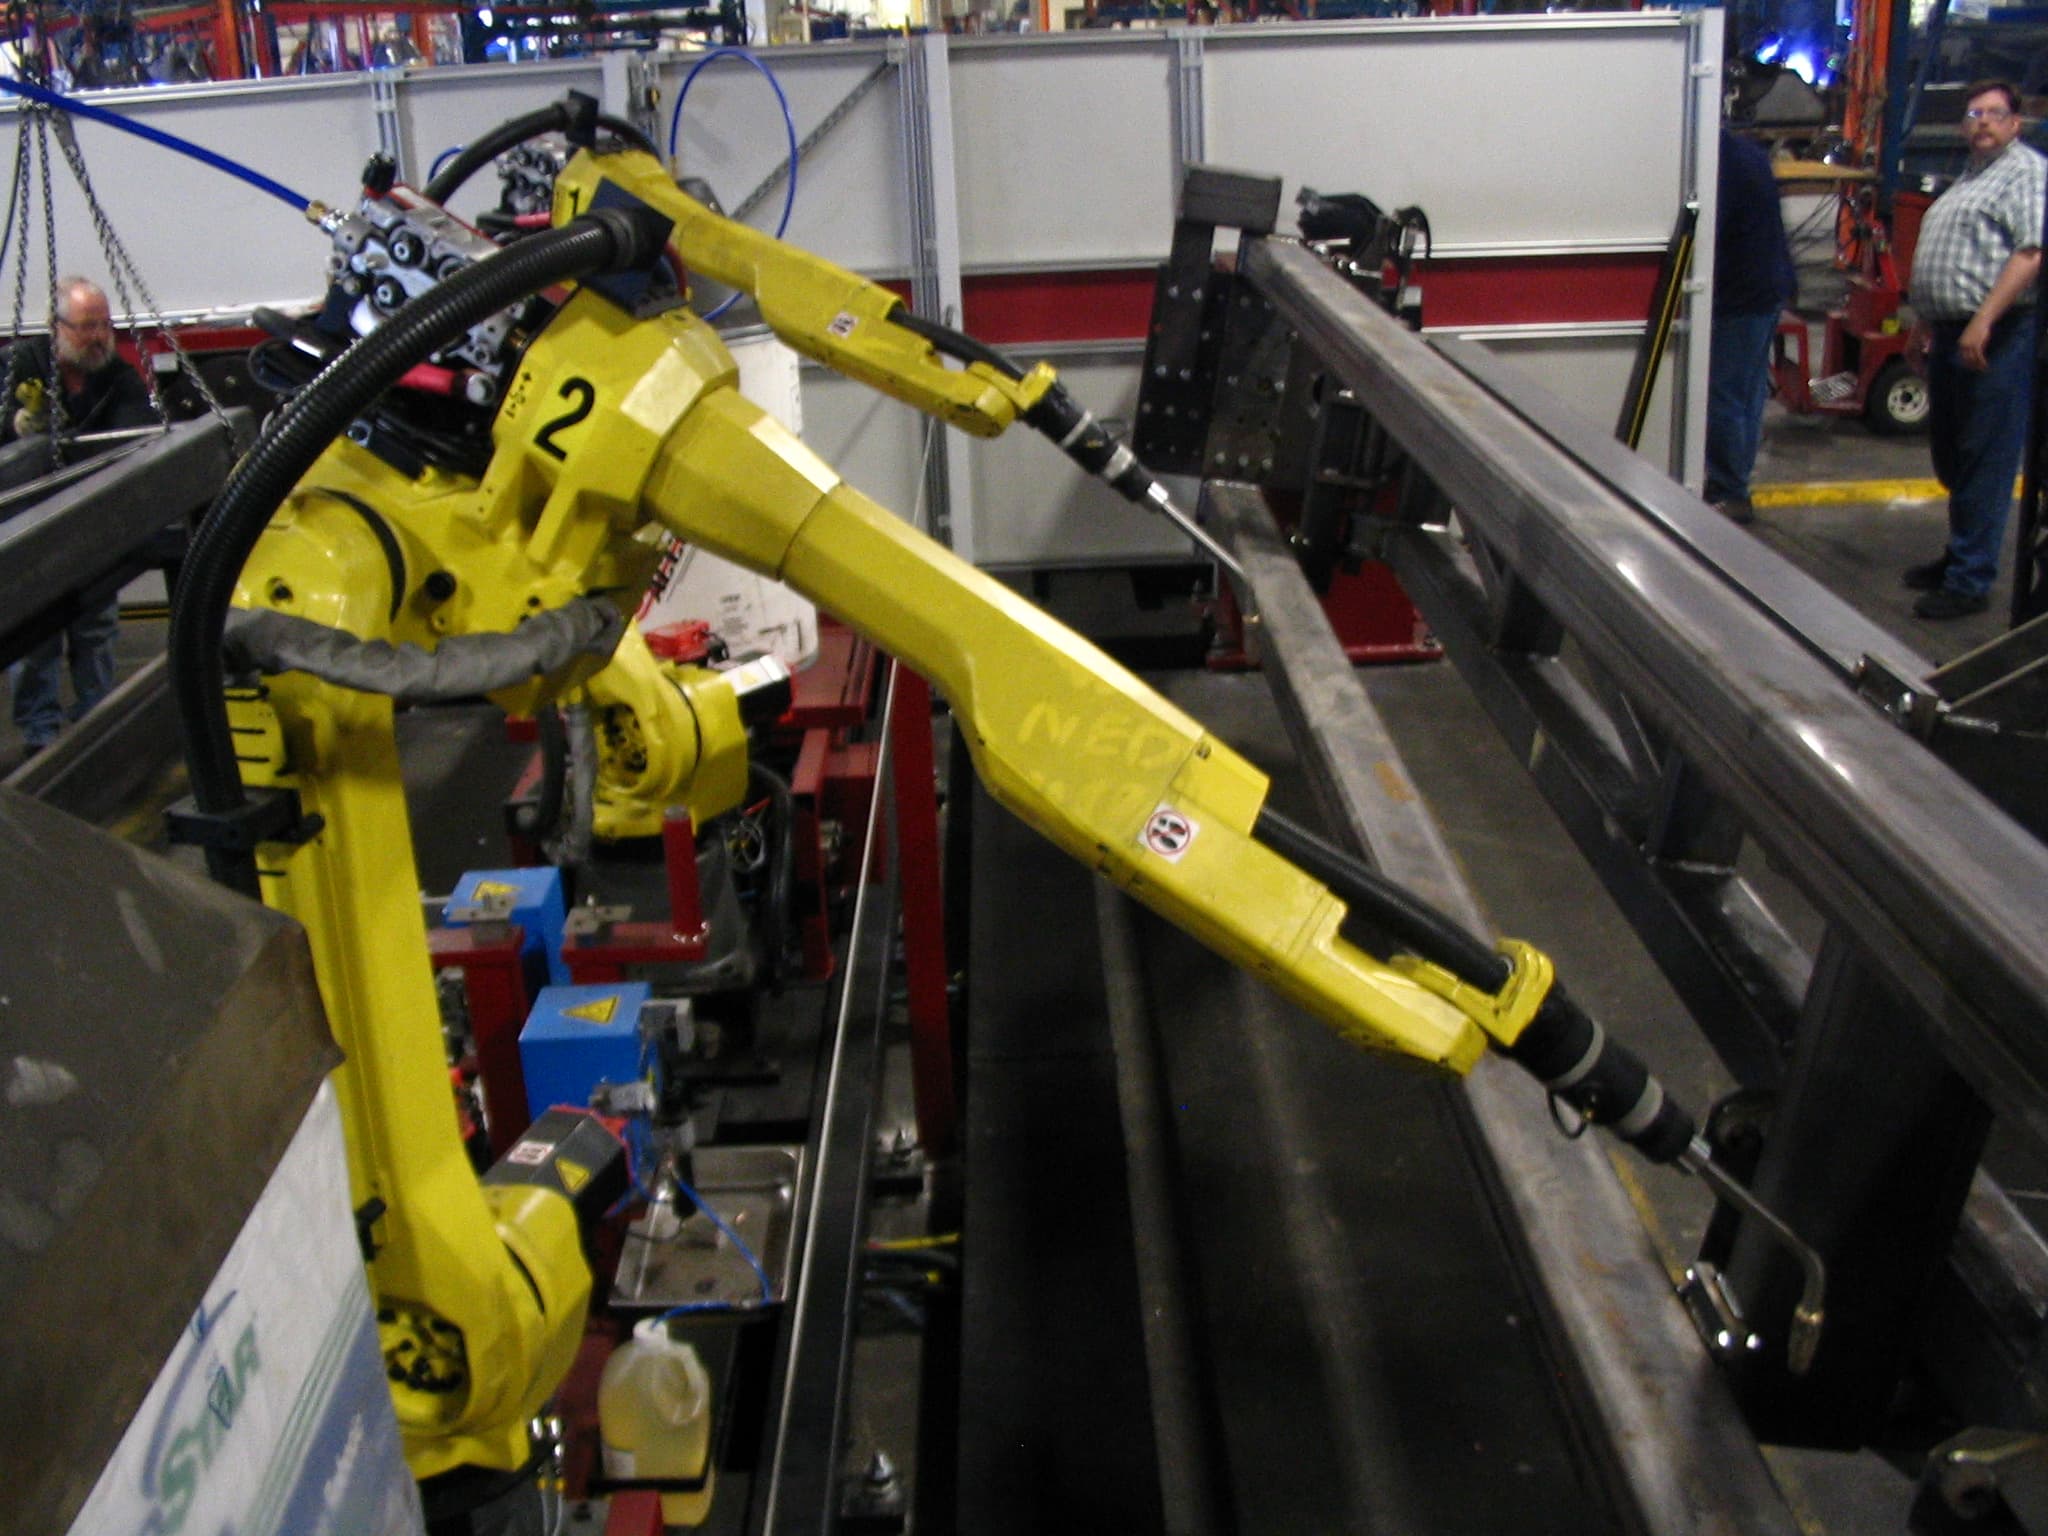
On Wednesday September 30, 2026, Anthropic published a research paper called What work can robots do?, authored by Russell Legate-Yang and Maxim Massenkoff. The paper runs Claude across the O*NET database of roughly 19,000 job tasks across 900 occupations and rates each one on a four-tier robot-exposure scale, then validates the whole thing against fifty years of U.S. wage and employment data. The headline number is that present-day robots can perform 74% of physical job tasks in at least some circumstances — the share of U.S. working hours is 34%. The number that actually matters is that robots are cost-competitive on 0.3% of those tasks today, and at historical price-decline rates reaching 10% takes roughly forty years.
That is the quietest "the robots are coming" paper of the year, filed by a frontier AI lab whose incentives are not usually aligned with "you have time."
The capability number is the headline. The price number is the story.
The four-tier scale is the paper's spine. E0 is the floor — tasks robots cannot perform at human-comparable standards, roughly 12% of U.S. working time. E1 is a purpose-built environment, the archetype being a car assembly line; that bucket is 23% of working hours. E2 is a structured human workplace, like an Amazon fulfilment centre or a sortation hub; another 10%. E3 is the unstructured world — city streets, a dinner service, a hospital corridor — and it is 1%. Add the three accessible tiers together and you get the 34% figure. Combine robot and large-language-model exposure and you cover 80% of U.S. working time by task, which is the number cable-news anchors will quote and the one that matters least.
The paper's own framing, as summarised in independent coverage, is that economic feasibility is the binding constraint. Linkdood's writeup pulled the single most useful worked example from the paper: packers and packagers, the largest U.S. occupation whose work is now mostly in reach of robots. Robots can perform approximately 97% of their tasks. An integrated robotic system to replace fourteen workers runs over $2 million, with annualised operating cost around $45,000 per worker-equivalent. The median packer earns about $49,000. The robots cost nearly as much as the people they replace, which is why they are not replacing the people. That is a sentence that, filed on a vendor blog in 2023, would have gotten the author quietly moved to the marketing floor.
The forty years assume a thing that has not been true for a decade
Here is the detail the headlines are going to skip. Anthropic's forty-year number is a projection: if robot prices continue to decline at historical trend rates, the share of cost-competitive tasks moves from 0.3% to 10% across roughly four decades. The historical trend baked into that assumption is the long industrial-robotics price curve from the 1990s through the mid-2010s. That curve went nearly flat around 2015, and the public price lists for KUKA, FANUC, ABB and Yaskawa industrial arms have moved sideways through most of the subsequent decade. Humanoid platforms are new, prices are opaque, and the few published Figure, Agility, and Unitree numbers are either preorder prices or capex-adjacent — not the labour-cost comparison Anthropic's model actually needs.
In other words, the forty-year figure is the optimistic read for people worrying about displacement. It is also the optimistic read for people building robots. One of those two groups will be publishing a response within a week.
Packers are the economically interesting case. Taxi drivers are the politically interesting one.
The most-exposed occupations are the ones you would predict and the ones you would not want to say out loud in front of them: taxi drivers, shuttle drivers and chauffeurs sit near the top of the index, followed by warehouse workers, order fillers, stockers, and recycling and reclamation workers. The paper's authors note that driving dominates the taxi score because robo-driving is now partially inside E3. Independent reporting and the paper's own historical backtest both lean on the long Acemoglu–Restrepo result that between 1990 and 2007 greater industrial-robot exposure was associated with lower U.S. employment and wages in affected labour markets. Anthropic finds the same pattern across its validation window — about fifty years of occupational wage and employment data.
Capability-side bottlenecks are where the paper gets specific. Roughly 70% of physical tasks are limited by capability rather than cost or law. Within that, manipulation — the single-robot-hand dexterity problem the industry has been working on since the 1970s — accounts for about 50% of task constraints. Planning and reasoning account for about 8%. Regulatory constraints block another 14%, and human preference — the share of work people simply do not want a robot doing — constrains 25%. Childcare, hospitality, personal services. The paper is admirably direct about this: a fraction of the automatable-but-not-automated share is not a technology problem at all.
The two automation waves hit opposite demographics
This is the finding the Loop keeps circling, because it is the finding the labour side of the AI debate has been waiting for, and because it is now in a frontier-lab paper rather than a labour-economics working draft.
Anthropic's own earlier exposure index — the LLM-side one — found that highly exposed workers were disproportionately educated, higher-paid, and female-weighted, with knowledge-work occupations like computer programmers at roughly 75% task coverage. The robot index inverts the demographic profile. Highly exposed workers here are more likely to be male, less educated, and lower-paid, with roughly double the baseline unemployment rate of unexposed workers.
Two automation waves, two demographic footprints, almost mirror-image. The policy response to one wave does not translate cleanly to the other. The retraining programs sold as a response to AI-knowledge-work displacement are the ones that worked worst for the manufacturing-displacement wave they were originally designed for. A labour market where both waves land in parallel across the next two decades is not the labour market the current retraining architecture was built to catch.

What this rewrites about the robot debate
The frontier-AI case for robotics in 2026 has run on three claims: capability is improving fast, deployment is accelerating, and the labour share of the economy is at risk on a horizon of years, not decades. Anthropic's paper endorses the first and complicates the second two. Capability is improving at roughly 2% of previously-impossible physical work annually, which is the same curve the industrial-robotics press has been reporting for a decade. Deployment, in installed-robot terms, is heavily concentrated: 600,000 industrial robots installed globally in 2025, a stock of about 5 million, with China taking 54% of global installations in 2024 and the U.S. about 38,000 units for the year. That is not a shortage of robots. It is a shortage of robots in the places where the paper says cost-competitiveness kicks in.
The forty-year number is where this paper will be weaponised in both directions. Labour groups will cite it as the evidence that frontier-lab research itself concedes the displacement curve is multi-decadal. Robotics firms will cite it as the floor case — the one where price trends do not accelerate — and point at humanoid programs as the reason to assume they will. Policy staff drafting the next round of state-level automation bills will cite whichever half of the paper matches their draft.
That is roughly the right outcome. A paper that is useful to all three sides at once is doing something right.
What this means, what to watch
- The forty-year projection is the number to argue about, not the 0.3%. The current cost-competitiveness figure is a snapshot. The projection is a prediction, and the price curve it depends on has been flat since roughly 2015. If humanoid platforms demonstrably break that curve downward in the next twenty-four months, the forty-year window collapses. If they do not, it widens.
- Watch the Figure, Agility, Unitree per-unit price disclosures through 2027. The paper's economic model needs a labour-comparable price, not a preorder price. Whichever humanoid vendor first publishes a three-year TCO against a packer wage will be setting the terms of the next version of this index.
- The demographic inversion is the policy sleeper. Male, less-educated, lower-paid workers with 2x baseline unemployment are the most-robot-exposed cohort. That is a different political coalition from the knowledge-worker cohort shaped by LLM exposure. The retraining architecture needs two tracks, and it currently has one.
- Expect the robotics industry's response within a week. The forty-year number is the single most quotable sentence in the paper for a labour organiser and the single most contestable one for a robotics CEO. The industry will not leave it unanswered.
The line the Loop will keep coming back to: the robots can do the work, they cannot yet afford to do the work, and the gap between those two sentences is the single most important industrial-economics finding of 2026. Anthropic filed it. The next twelve months will be about which parts of it get kept.
* * *
Thanks for reading. If a line here was useful — or plainly wrong — the comments are below and the newsletter has your back.
Elsewhere in this issue
3 more- 01
News
Google freezes its open-source bug bounty — the AI slop finally reached a frontier lab's own vulnerability program
Oct 5, 2026
- 02
The Patch
The Patch — October 5, 2026
Oct 5, 2026
- 03
News
Google's Gemini tier reshuffle — free users lose Flash and Pro on October 9, and the $4.99 subscribers lose Pro four months after it was the pitch
Oct 4, 2026
Letters
Arguments, corrections, questions. Anonymous comments allowed; be kind, be specific.